Evolutionary Coupling Analysis
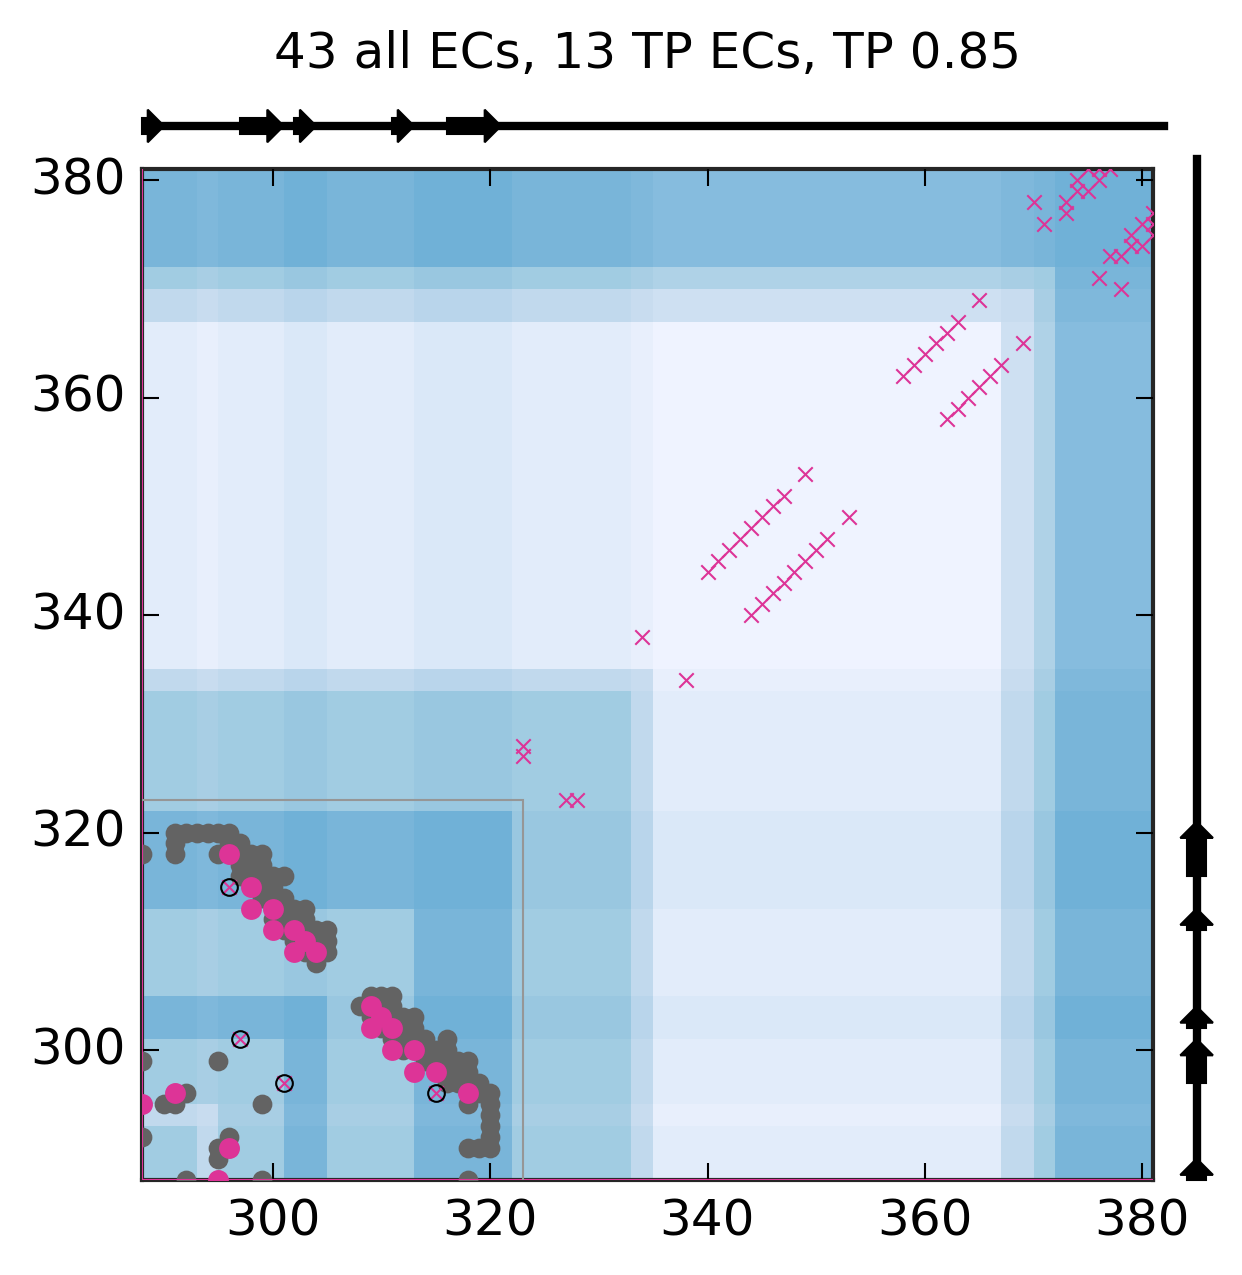
Predicted and experimental contacts
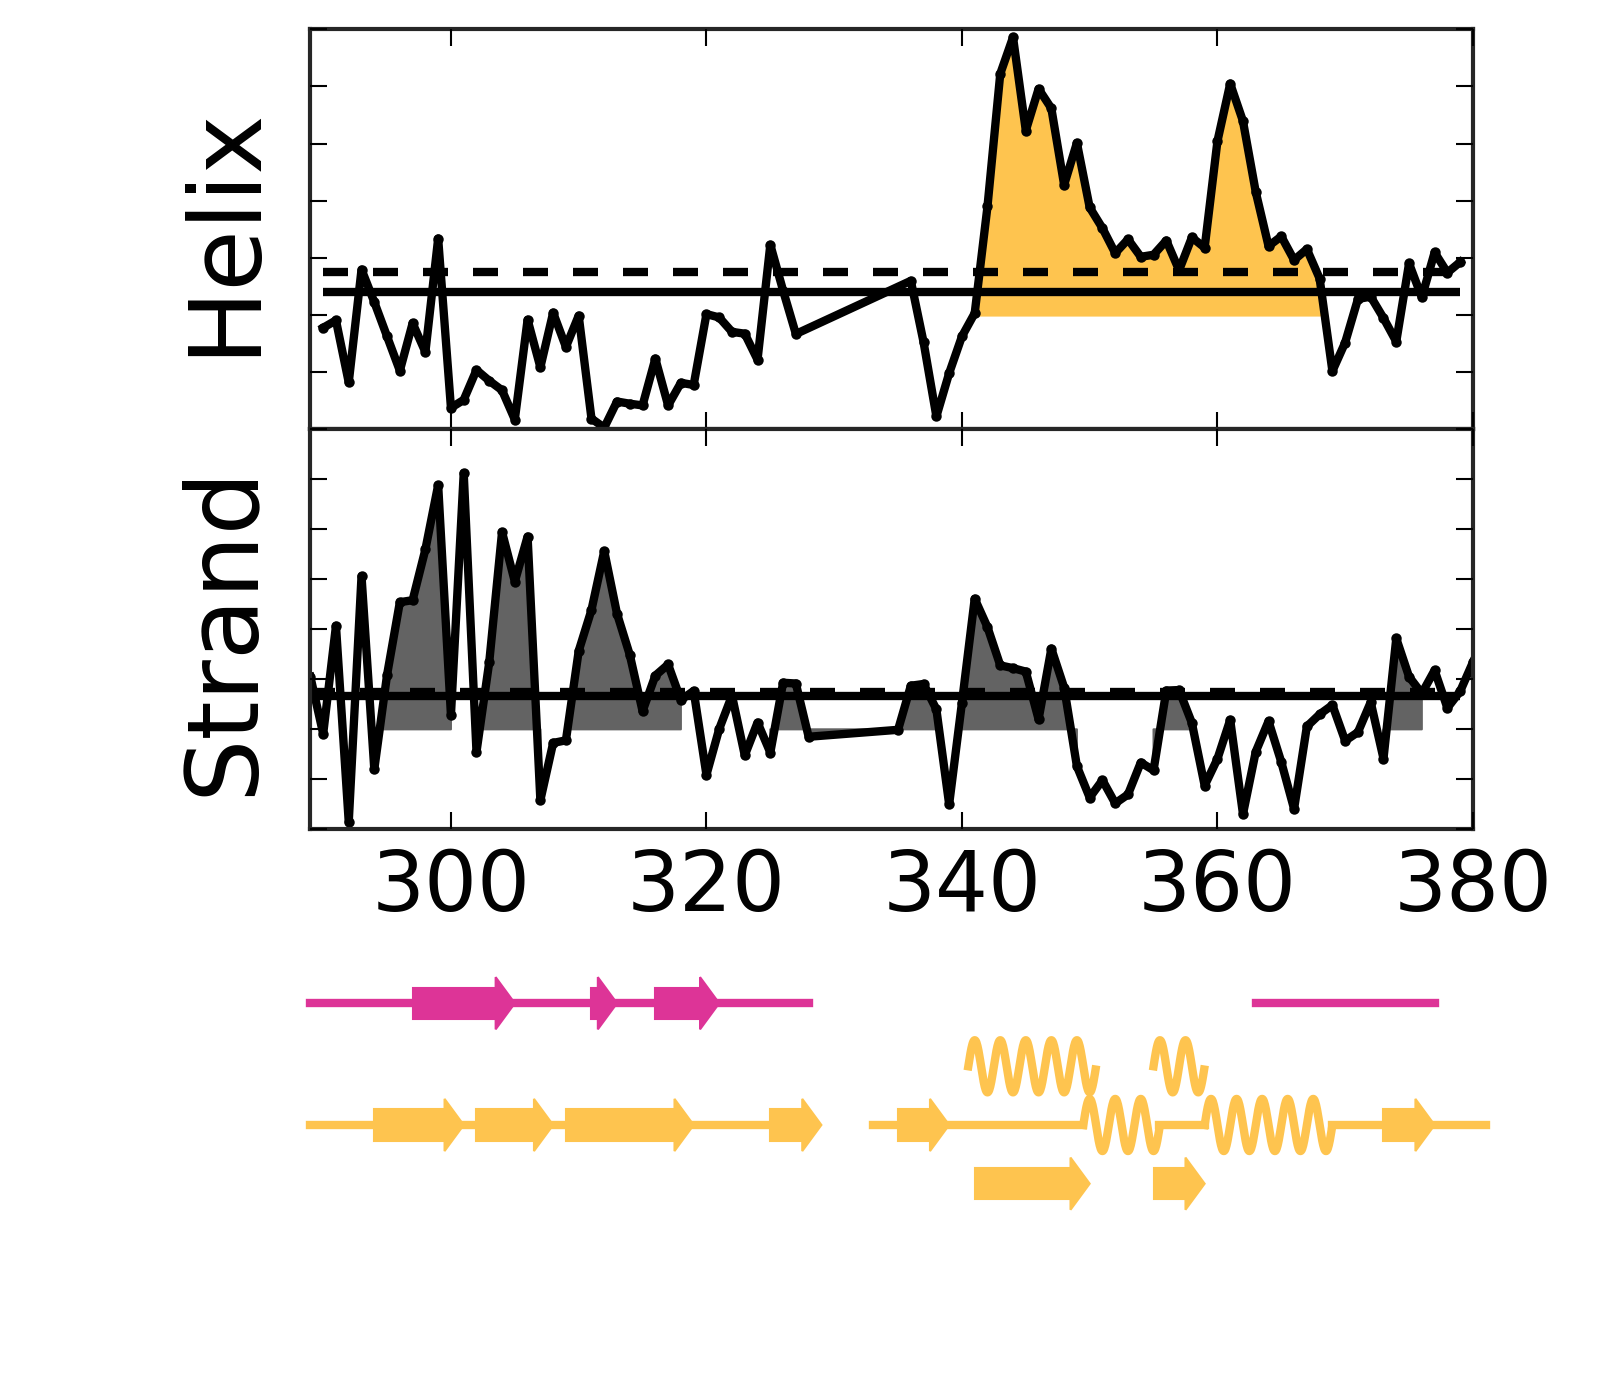
Secondary structure from ECs
Known pdb structures
| pdb |
chain |
| 2ens |
A |
| 2le9 |
A |
| 2lmb |
A |
EC score distribution and threshold
Top ECs
| Rank |
Residue 1 |
Amino acid 1 |
Residue 2 |
Amino acid 2 |
EC score |
| 1 |
342 |
A |
346 |
G |
1.37 |
| 2 |
341 |
L |
345 |
L |
1.30 |
| 3 |
344 |
A |
348 |
L |
1.15 |
| 4 |
298 |
T |
313 |
S |
1.08 |
| 5 |
345 |
L |
349 |
G |
1.00 |
| 6 |
343 |
L |
347 |
I |
0.97 |
| 7 |
304 |
T |
309 |
G |
0.94 |
| 8 |
296 |
Q |
318 |
I |
0.89 |
| 9 |
298 |
T |
315 |
A |
0.86 |
| 10 |
360 |
V |
364 |
Q |
0.86 |
| 11 |
359 |
G |
363 |
W |
0.85 |
| 12 |
297 |
G |
301 |
C |
0.82 |
| 13 |
340 |
T |
344 |
A |
0.77 |
| 14 |
358 |
I |
362 |
L |
0.76 |
| 15 |
300 |
S |
311 |
Q |
0.74 |
| 16 |
300 |
S |
313 |
S |
0.71 |
| 17 |
362 |
L |
366 |
R |
0.71 |
| 18 |
302 |
V |
309 |
G |
0.69 |
| 19 |
347 |
I |
351 |
L |
0.68 |
| 20 |
302 |
V |
311 |
Q |
0.68 |
| 21 |
361 |
I |
365 |
R |
0.68 |
| 22 |
377 |
E |
381 |
E |
0.67 |
| 23 |
323 |
P |
328 |
P |
0.63 |
| 24 |
374 |
K |
380 |
E |
0.62 |
| 25 |
334 |
G |
338 |
L |
0.61 |
| 26 |
291 |
I |
296 |
Q |
0.60 |
| 27 |
375 |
A |
379 |
Q |
0.59 |
| 28 |
346 |
G |
350 |
G |
0.58 |
| 29 |
363 |
W |
367 |
Q |
0.56 |
| 30 |
365 |
R |
369 |
R |
0.55 |
| 31 |
288 |
L |
295 |
D |
0.55 |
| 32 |
373 |
R |
377 |
E |
0.53 |
| 33 |
323 |
P |
327 |
G |
0.51 |
| 34 |
303 |
A |
310 |
P |
0.51 |
| 35 |
371 |
E |
376 |
P |
0.50 |
| 36 |
376 |
P |
380 |
E |
0.50 |
| 37 |
296 |
Q |
315 |
A |
0.50 |
| 38 |
374 |
K |
379 |
Q |
0.49 |
| 39 |
373 |
R |
378 |
N |
0.46 |
| 40 |
349 |
G |
353 |
T |
0.45 |
| 41 |
375 |
A |
381 |
E |
0.45 |
| 42 |
376 |
P |
381 |
E |
0.44 |
| 43 |
370 |
G |
378 |
N |
0.44 |
Alignment robustness analysis
First most common residue correlation
Second most common residue correlation